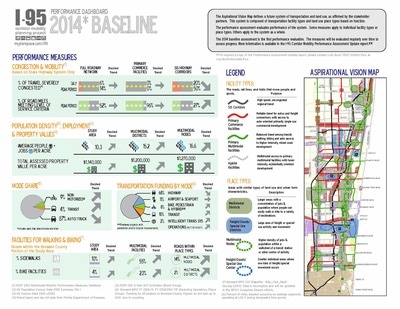
Performance MeasuresAs a part of monitoring and evaluation activities, a diverse set of 26 performance measures are periodically evaluated to track progress toward the aspirational future transportation and land use vision. The 26 measures were carefully selected and vetted with the Working Group to reflect the unique functions of the facility types and place types.
Some measures, such as average travel speed and percent of travel severely congested, evaluate the ability of Strategic Intermodal System (SIS) Corridors and Primary Commerce facilities to provide reliable mobility for freight trips and commuter access to employment centers. Other measures, such as population and employment density and sidewalk coverage, are more relevant to Multimodal Districts and Nodes and Primary Multimodal Facilities. |
26 Performance Measures1. Traffic Volume 2. Vehicle Miles of Travel 3. VMT per Capita 4. Greenhouse Gas Emissions 5. Daily Truck Volume 6. I-95 Interchange Volumes 7. Average Travel Speed 8. Percent of Travel Severely Congested 9. Hours of Travel Severely Congested 10. Percent Travel Meeting Level of Service Criteria 11. Travel Time Reliability 12. Freight Travel Time Reliability 13. Person Throughput 14. Cargo Volume - Airport and Seaport 15. Passenger Volume - Airport and Seaport 16. Commute Mode Share 17. Average Travel Time to Work 18. Employment Density 19. Population Density 20. Transit Ridership 21. Percent Transit Coverage 22. Sidewalk Coverage 23. Bike Lane/Shoulder Coverage 24. Bicycle and Pedestrian Safety 25. Property Values 26. Transportation Funding |
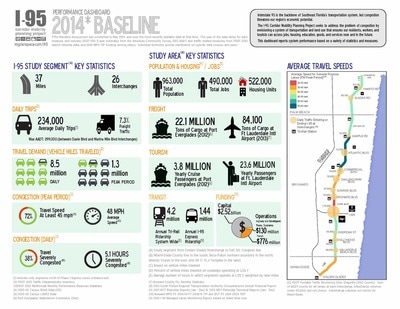
In 2014, the project team conducted the Baseline Performance Assessment, which provides a snapshot of existing conditions and identifies desired trends. The Baseline Assessment results are summarized in a two-page Baseline Performance Dashboard.
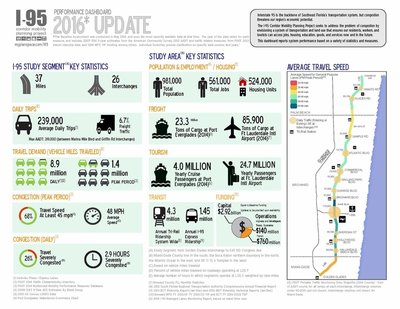
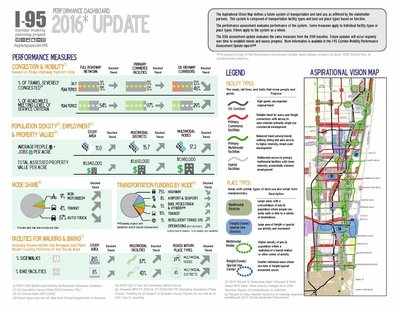
In 2016, the project team re-evaluated the 26 performance measures using the latest available data and documented the results in the 2016 Performance Assessment Update Report, which includes a section on challenges encountered, recommendations, and considerations for future updates. The two-page 2016 Performance Dashboard shows the results at a glance.
The 2016 Assessment Update adds one to two data points for each of the 26 measures to the first data points established in the Baseline Assessment. It is too early to discern any trends from the limited number of data points, and readers should refrain from drawing conclusions at this time.
The 2016 Assessment Update adds one to two data points for each of the 26 measures to the first data points established in the Baseline Assessment. It is too early to discern any trends from the limited number of data points, and readers should refrain from drawing conclusions at this time.
Capstone Measures to be Considered
In response to stakeholder feedback, the project team is contemplating enhancing the performance measures and performance assessment process through collaboration with the Core Group and the Working Group for the I-95 CMPP. Stakeholders suggested setting performance targets and using performance results to communicate the project’s purpose, themes, and takeaways with elected officials and the general public.
With the Core and Working Groups, the project team intends to develop capstone performance measures for the facility types and place types that are based on emerging national research and newly available analysis methods. The capstone measures will roll up multiple performance goals into a single measure. The capstone performance measures will be a complement to the I-95 CMPP’s Performance Dashboard.